The PLC model can be utilized for portfolio analysis
Do we have an appropriate balance of existing products in a mature market, and are we investing in future new product opportunities by entering products into introduction and growth stage markets? Again, this is conceptually similar to the underlying principle of the Boston Consulting Group matrix – in terms of reinvesting profits from established/stable products towards products competing in growth markets.
Portfolio analysis is using various models/matrices to help the firm make decisions on its overall product offering and business portfolios. The product life cycle curve can be effectively utilized for the purposes of portfolio analysis.
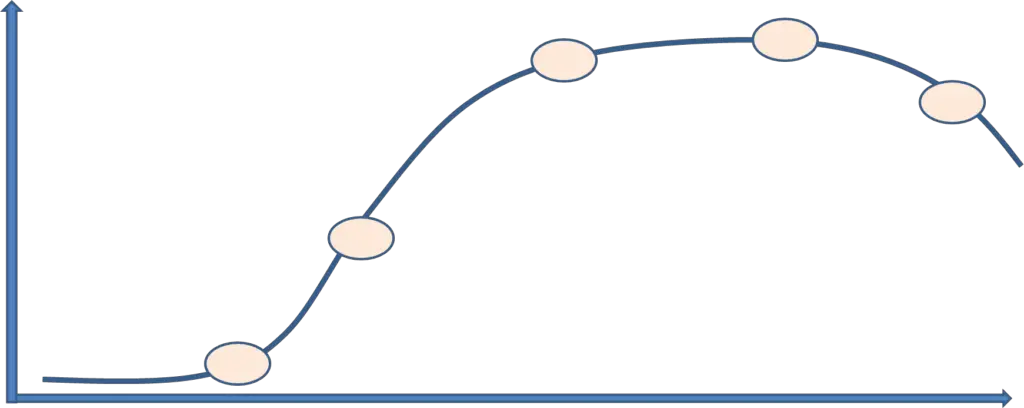
Typically a firm could map out its core sets of related products to see its proportion of products in the various stages of the product life cycle. A balanced product portfolio should consist of multiple products in the mature stage – which generate good profitability and provide cash flow stability – while ensuring that they have suitable product portfolios within both introduction and growth stages of the PLC – as these will provide the future profits for the firm and ensure that they are able to remain competitive against new players and offerings, as well as adapting to changing consumer preferences and needs.
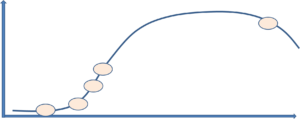
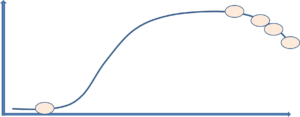
The following charts demonstrate how this could easily be visually achieved. For example, the first chart provides an overview of a well-balanced product portfolio where there is a mix of current profit and future profit portfolios.
However, the other charts demonstrate a poorly balanced product portfolio, that either has limited future visions by over relied upon current profitability and current mature markets or is too aggressive for future profitability and is eroding current profitability as a result.
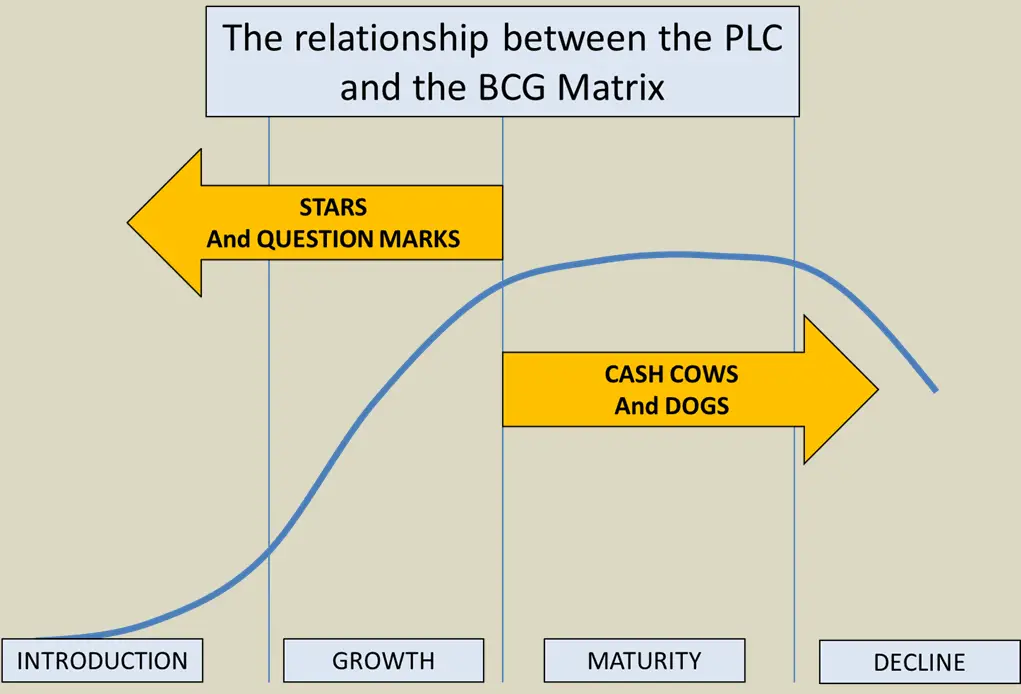
PLC and the BCG Matrix
You should note that the linkage/connection between the product life cycle and the Boston Consulting Group model/matrix. The BCG matrix uses the market growth rate as a classification on one of its attributes. As a result, only products that sit in the introduction and/or growth stages of the PLC can be classified as either stars or question marks, and products in the maturity and decline stages of the PLC would therefore be classified as cash cows or dogs. This is demonstrated in the following visual image of the connection between the PLC and the BCG matrix.


