Contents
Your Guide to Making Cross-tabs in Excel
What are Cross-tabs?
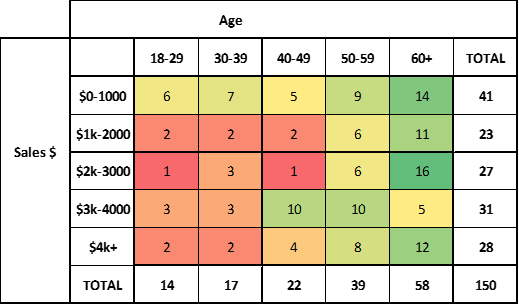
Cross-tabs, short for cross-tabulations, are a marketing research tool used to analyze the relationship between two or more variables. Cross-tabs are data tabled in a matrix form that displays interrelation between two or more variables, as shown in the example below.
VIDEO: How to Make and Run Cross-tabs in Excel
And check out the free Excel template: Free Template: Run Cross-Tabs in Excel
Why Build Your Own Excel Cross-tab Template?
The real question is why not? There are so many advantages of a tailored cross-tab tool, as opposed to the standard pivot table approach.
Creating a customized cross-tab template is ideal for Excel novice users who may not be comfortable with using pivot table.
And as you can see from the video instructions, a customized cross-tab Excel template can be designed to be user-friendly and very simple.
They can offer a simpler, more straightforward, and much faster way of analyzing data, especially if there are 100s of marketing variables to crunch through.
The construction of the cross-tab tool means that a marketing analyst can review far more cross-tabs than they could using pivot table – as the design describe makes cross-tabs much faster and simpler.
Plus, once set up correctly and tested, there is very little chance of errors, again as compared to pivot tables where the wrong variable or filter may ne included by accident.
And it provides a consistent and standard format, making it easier for multiple people in an organization to use and understand.
Your custom cross-tab templates (yes, you can make more than one) can also provide a level of automation that is not easily achieved with pivot tables. If a user needs to create the same type of cross-tab regularly, a template can speed up the process significantly.
The template can be designed to pull in data from a specified location automatically, create the cross-tab, and even highlight key findings. This can be particularly useful for regular reporting tasks.
And as another benefit, a tailored cross-tab tool allows for more customization than pivot tables. It can be formatted to match the company’s branding or reporting standards, include specific calculations or summaries, or be designed to highlight particular types of findings.
Once set up, the template can save time and effort in the data analysis process, freeing up staff to focus on interpreting the findings and making data-driven decisions.
And it can reduce the need for Excel training, as users only need to understand how to use the template, not how to create a cross-tab from scratch.
Why cross-tabs are important in marketing analysis
Identifying Patterns and Relationships
Cross-tabs can help identify patterns or relationships that might not be readily apparent in a large dataset. For instance, they can show how purchase behavior differs by market segments.
Understanding Interactions Between Variables
They allow the analyst to understand the interaction effects between different variables, which could be very insightful and sometimes non-intuitive.
Segmentation Analysis
They are also used for segmentation analysis, helping in understanding the behavior of different customer groups.
Hypothesis Testing
Cross-tabulation helps in hypothesis testing. It can give initial insights about whether certain variables are related or independent.
Comparative Analysis
Cross-tabs can be used to compare the behavior and responses of different groups within the dataset.
Simplicity and Accessibility
Cross-tabs are easy to interpret and understand. They can be readily used by decision-makers to understand data quickly.
Related Tools and Information

